
Key data
Our portfolio
Making a financial return means we can recycle the money into new investments, to create jobs and pay taxes beyond our involvement. In 2025, we made £1.8 billion of gross new commitments. Our portfolio fell by £650 million to £6.6 billion.
Our portfolio size
2021
£6011m
2022
£6888m
2023
£7319m
2024
£7291m
2025
£6641m
How we invest in regions
The countries we invest in each have unique opportunities and needs. We invest in countries in Africa, Asia and the Caribbean. At the end of 2025, we had direct and indirect investments in 1,700 businesses – including 899 in Africa and 760 in our target countries in Asia.
Top 10 countries we are invested in
India
24%
Egypt
10%
Kenya
7%
South Africa
7%
Nigeria
6%
Pakistan
4%
Morocco
3%
Bangladesh
3%
Uganda
2%
Senegal
2%
Regional breakdown of our portfolio
Africa
$5534.9m (60%)
Asia
$3252.2m (36%)
Rest of world
$370.2m 4%)
Regional breakdown of our 2025 commitments
Africa
£1071m (59%)
Asia
£712.1m (39%)
Other (This includes investments that span both Africa and Asia, as well as investment in other countries beyond these regions)
£40.4m (2%)
Country breakdown of our portfolio
| Country | 2025 closing valuation ($m) | Number of companies |
| India | 2,111.5 | 610 |
| Egypt | 847.9 | 89 |
| Africa | 655.7 | 51 |
| Kenya | 625.8 | 123 |
| South Africa | 588.7 | 99 |
| Nigeria | 518.8 | 105 |
| Pakistan | 358.8 | 38 |
| Morocco | 304.9 | 37 |
| Bangladesh | 270.4 | 19 |
| Global | 261.5 | 22 |
| Uganda | 180.7 | 45 |
| Senegal | 175.4 | 21 |
| Tanzania | 161.9 | 27 |
| East Africa | 156.6 | 5 |
| Ghana | 155.7 | 32 |
| Zimbabwe | 153.1 | 21 |
| Cote d’Ivoire | 127.1 | 31 |
| Vietnam | 121.8 | 15 |
| Zambia | 100.1 | 21 |
| Cameroon | 91.8 | 12 |
| Gabon | 84.3 | 5 |
| Mauritius | 83.4 | 12 |
| Ethiopia | 82.6 | 20 |
| Nepal | 80 | 13 |
| Rwanda | 62.2 | 10 |
| Mozambique | 41.2 | 9 |
| Democratic Republic of Congo | 40.2 | 36 |
| Philippines | 36.9 | 13 |
| Madagascar | 30.6 | 6 |
| Tunisia | 28 | 9 |
| Thailand | 27.1 | 6 |
| West Africa | 24.3 | 6 |
| Sierra Leone | 21.2 | 7 |
| Malawi | 18.7 | 10 |
| Ukraine | 18.2 | 4 |
| Mali | 15.3 | 5 |
| Myanmar | 13.8 | 9 |
| Benin | 13.2 | 4 |
| Indonesia | 12.3 | 11 |
| Burkina Faso | 8.2 | 4 |
| Cambodia | 6.9 | 5 |
| Angola | 3.4 | 5 |
| Mexico | 1.8 | 6 |
| Namibia | 1.7 | 4 |
| Other countries with 3 or less investments | 172.4 |
How we invest in sectors
A focus on, and expertise in, key economic sectors is central to our approach to making successful investments. We prioritise those sectors that facilitate development and need our capital the most. Our priority sectors contribute towards many of the SDGs. These sectors range from investing in the power infrastructure that will provide people with better access to electricity; to sectors that are powerful job creators or sectors that are critical for improving access to basic goods and services; to investing in financial institutions that direct capital to the individuals and enterprises that need it.
Sector breakdown of our portfolio
Financial services
$2699.9m (30%)
Infrastructure
$2678.9m (30%)
Technology and telecoms
$929.9m (11%)
Manufacturing
$736.2m (8%)
Health
$574.6m (7%)
Business and consumer services
$529.5m (6%)
Food and agriculture
$413.8m (5%)
Construction and real estate
$276.6m (3%)
Education
$56.7m (1%)
Sector breakdown of our 2025 commitments
Financial services
£795.6m (44%)
Infrastructure
£637.2m (35%)
Business and consumer services
£138.5m (8%)
Manufacturing
£75.7m (4%)
Food and agriculture
£74.2m (4%)
Technology and telecoms
£68.4m (4%)
Other
£18.9m (1%)
Health
£14.6m (1%)
Construction and real estate
£0.4m (0%)
Number of companies in our portfolio by sector
| Sector | Company count |
| Financial services | 343 |
| Technology and telecoms | 315 |
| Infrastructure | 302 |
| Manufacturing | 191 |
| Business and Consumer Services | 178 |
| Food and agriculture | 138 |
| Health | 134 |
| Construction and real estate | 69 |
| Education | 28 |
How we invest in different product types
We provide the flexible long-term investment that many businesses in developing countries need to grow. This capital is provided in different ways, through direct equity, intermediated equity, debt and trade finance.
Product breakdown of our portfolio
Intermediated equity
$3226.3m (36%)
Direct equity
$2927.8m (33%)
Debt
$2682.6m (30%)
Guarantees
$59.4m (1%)
Product breakdown of our 2025 commitments
Debt
£1078.3m (59%)
Intermediated equity
£326.8m (18%)
Direct equity
£271.7m (15%)
Guarantees
£146.7m (8%)
The impact of our investments
In 2025, our portfolio of businesses in Africa and Asia provided direct jobs for over 1 million people (in full-time equivalents). The net increase in jobs in our portfolio was 25,060.
Direct jobs supported at the start of the year by our investee companies
2021
916,050
2022
904,110
2023
997,751
2024
1,024,290
2025
1,059,280
Additional jobs supported at end of year
2021
22,310
2022
54,090
2023
84,619
2024
82,410
2025
25,060
Direct jobs supported by our investee companies by country in 2025
| Country | Jobs |
| India | 404,180 |
| Egypt | 130,659 |
| Nigeria | 66,378 |
| Kenya | 57,253 |
| Bangladesh | 52,473 |
| Ethiopia | 50,262 |
| Global and non-country specific (e.g. Asia, Western Africa) | 46,247 |
| Morocco | 43,217 |
| South Africa | 40,371 |
| Tanzania | 24,786 |
| Pakistan | 23,366 |
| Cote d’Ivoire | 19,348 |
| Ghana | 13,932 |
| Indonesia | 10,354 |
| Zimbabwe | 9,611 |
| Zambia | 9,403 |
| Tunisia | 8,352 |
| Mauritius | 7,512 |
| Myanmar | 5,962 |
| Uganda | 4,179 |
| Nepal | 4,120 |
| Cameroon | 3,690 |
| Gabon | 2,990 |
| Senegal | 1,931 |
| Mozambique | 1,535 |
| Singapore | 1,457 |
| Rwanda | 668 |
| Malawi | 583 |
| Madagascar | 567 |
| Vietnam | 310 |
| Philippines | 168 |
Direct jobs supported by our investee companies by region in 2025
Africa
52%
Asia
48%
Direct jobs supported by our investee companies by sector
Financial services
43%
Business and consumer services
15%
Technology and telecoms
10%
Food and agriculture
9%
Manufacturing
9%
Health
8%
Infrastructure
4%
Education
2%
Construction and real estate
1%
Direct jobs supported by our investee companies by gender in 2025
Men
73%
Women
27%
Private sector capital our investments have helped mobilise: Organisation for Economic Co-operation and Development Method
2021
$2064m
2022
$1376m
2023
$929m
2024
$1585m
2025
$1703m
Private sector capital our investments have helped mobilise: Multilateral Development Bank Method
2021
$2085m
2022
$1434m
2023
$938m
2024
$1553m
2025
$1692m
Taxes paid by our investee companies
2021
$1.51bn
2022
$1.79bn
2023
$2.42bn
2024
$2.5bn
2025
$5.5bn
Taxes paid by our investee companies by sector
Financial services
63%
Technology and telecoms
15%
Health
9%
Infrastructure
6%
Business and consumer services
4%
Food and agriculture
1%
Manufacturing
1%
Construction and real estate
1%
Education
0%
Taxes paid by our investee companies by country in 2025
| Country | Taxes paid $ |
| Bangladesh | 150,620,406 |
| Cote d’Ivoire | 191,788,759 |
| Democratic Republic of Congo | 12,880,967 |
| Egypt | 1,357,029,178 |
| Ethiopia | 24,920,701 |
| Ghana | 4,330,339 |
| Global and non-country specific (e.g. Asia, Western Africa) | 171,442,014 |
| India | 712,406,459 |
| Indonesia | 16,979,546 |
| Kenya | 358,599,493 |
| Madagascar | 1,439,603 |
| Mauritius | 15,141,727 |
| Morocco | 295,724,832 |
| Mozambique | 5,388,099 |
| Nigeria | 541,175,458 |
| Pakistan | 370,248,470 |
| Philippines | 1,228,074 |
| Singapore | 1,891,889 |
| South Africa | 105,816,755 |
| Uganda | 25,983,715 |
| Zimbabwe | 217,038,929 |
Customers reached by our financial services portfolio
2021
132m
2022
121m
2023
135m
2024
150m
2025
213m
Loans supplied by our investee companies
2021
$99.8bn
2022
$86.1bn
2023
$105.8bn
2024
$102.8bn
2025
$166.8bn
Gigawatt hours of electricity produced by our investments
2021
58,040
2022
49,873
2023
48,007
2024
47,272
2025
44,760
Farmers reached by our investee companies
2021
1,878,810
2022
9,994,850
2023
13,165,320
2024
10,271,680
2025
24,752,090
Patients served by our investee companies
2021
11,647,620
2022
12,898,077
2023
12,232,760
2024
13,132,920
2025
12,839,140
Learners reached by our investee companies
2021
1,782,810
2022
3,046,090
2023
4,254,050
2024
2,891,480
2025
2,765,790
Supporting countries most in need
As part of our Impact Score, we rank all the countries we invest in from ‘Alpha’ to ‘Delta’ according to their GDP per capita, fragility measures and poverty gap. Alpha is the most in need and Delta the least. A detailed breakdown of our approach to country segmentation is available in our Impact Score.
Commitments to countries most in need in 2025
Alpha
£326.2m
Beta
£403.2m
Gamma
£900.5m
Delta
£124.5m
Non-BII geography (Ukraine)
£68.1m
Supporting the Sustainable Development Goals
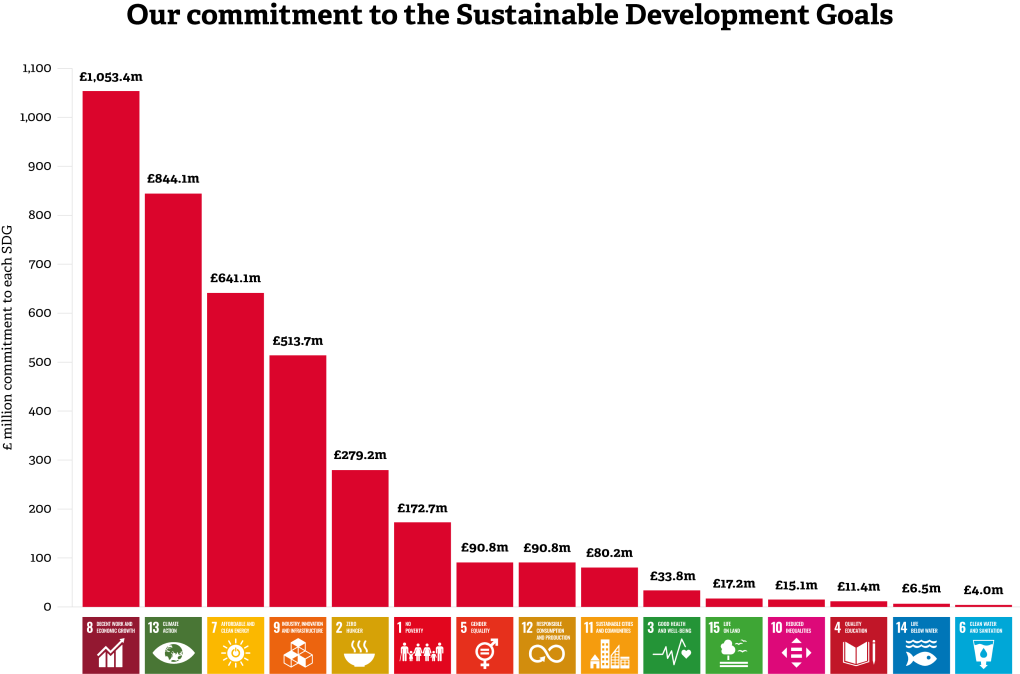
For each investment we make, we link the expected impact of the investment to the Sustainable Development Goals (SDGs). The chart shows the value of our 2025 commitments aimed at addressing each Sustainable Development Goal. Please note that some individual commitments target multiple SDGs, which means the sum of the commitments shown on this chart is greater than our total 2025 commitment figure. Click here to see a larger version of the chart below.
Publications
Document name
File
Size
633 KB
237 KB
710 KB
589 KB
589 KB
969 KB
612 KB
175 KB
362 KB
805 KB